Upload a GPX file to view your GPS track on an interactive map with a full elevation profile chart. All processing is done in your browser — your file is never uploaded to a server.
View Your GPX File on a Map with Elevation Profile
For decades, navigating the outdoors was primarily a two-dimensional puzzle. Hikers, runners, and cyclists relied on top-down maps to chart a course, calculating distances as flat lines across a page. But anyone who has tackled a mountain trail knows that distance is a deceptive metric. A ten-kilometre flat run along a coastline demands an entirely different physical effort than a ten-kilometre mountain ascent with heavy vertical climbs.
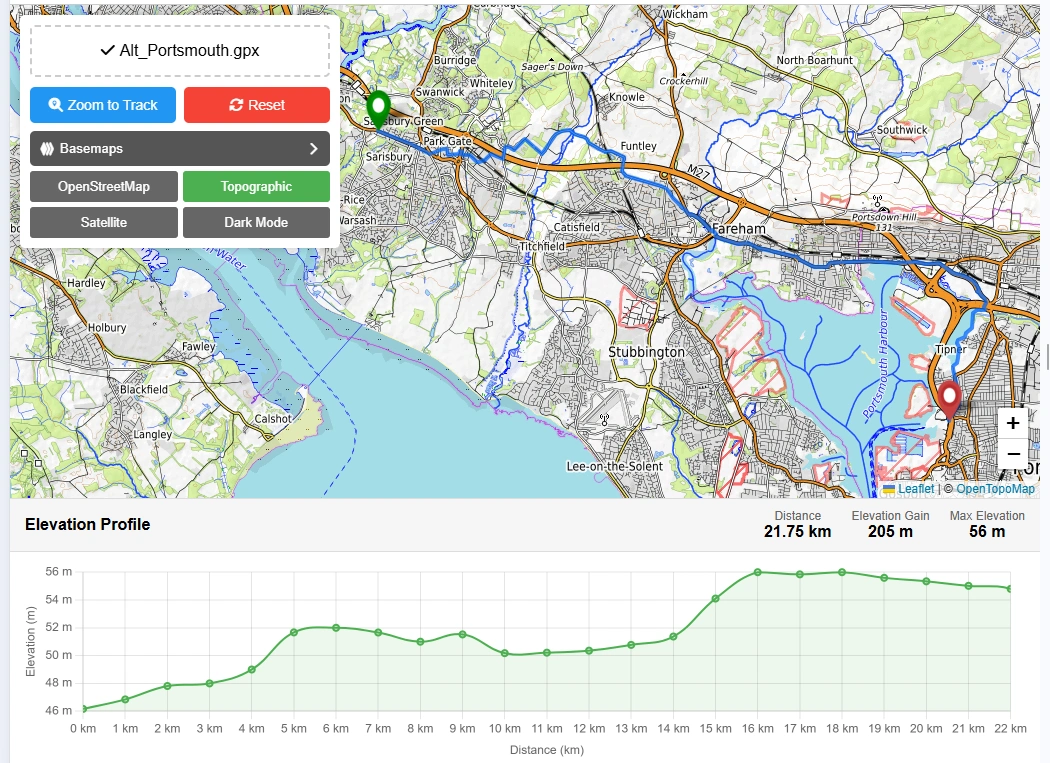
This free GPX file viewer solves that problem. Upload any GPX 1.1 file and the tool instantly renders your GPS track on an interactive map alongside a full elevation profile chart — hover any point on the chart and a marker syncs on the map to show you exactly where the steepest climbs and descents lie. Key statistics are calculated automatically: total distance, elevation gain ↑ and loss ↓, max/min altitude, and trip duration if your file includes timestamp data.
Key Features
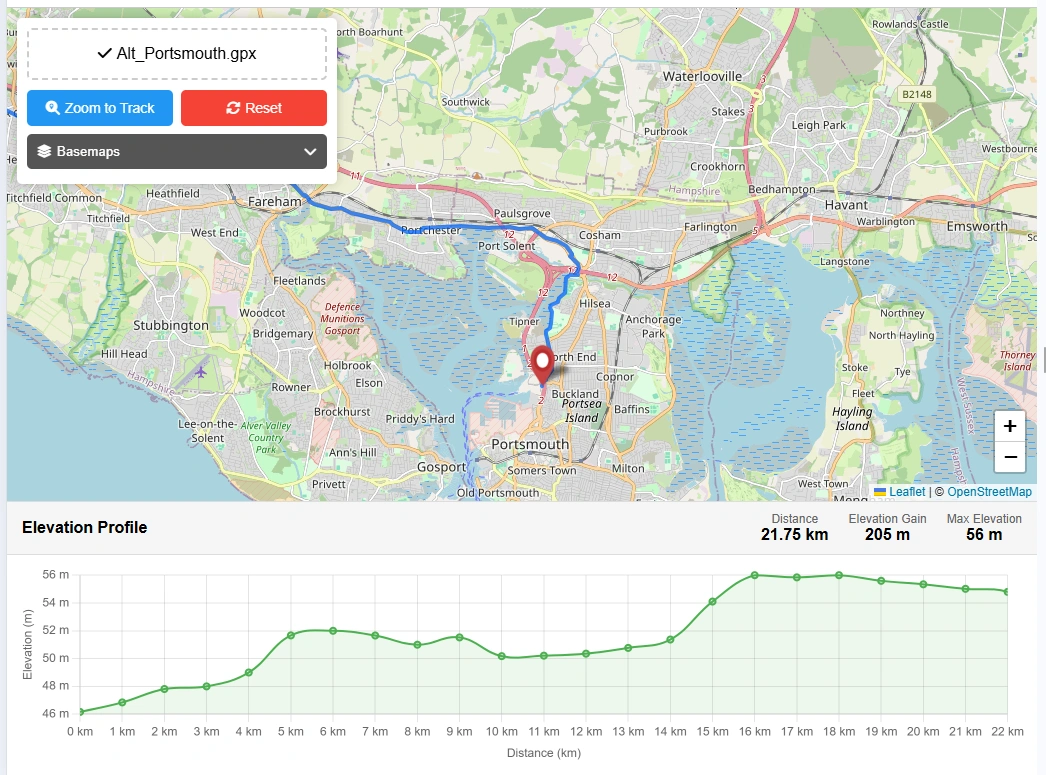
- Interactive Map — GPS track rendered as a blue polyline with green start and red end markers
- Elevation Profile Chart — SVG area chart showing elevation against distance along the track
- Hover Inspection — hover over the chart to see distance and elevation; a marker syncs on the map
- Track Statistics — total distance (km), elevation gain ↑, elevation loss ↓, max/min elevation, point count, duration
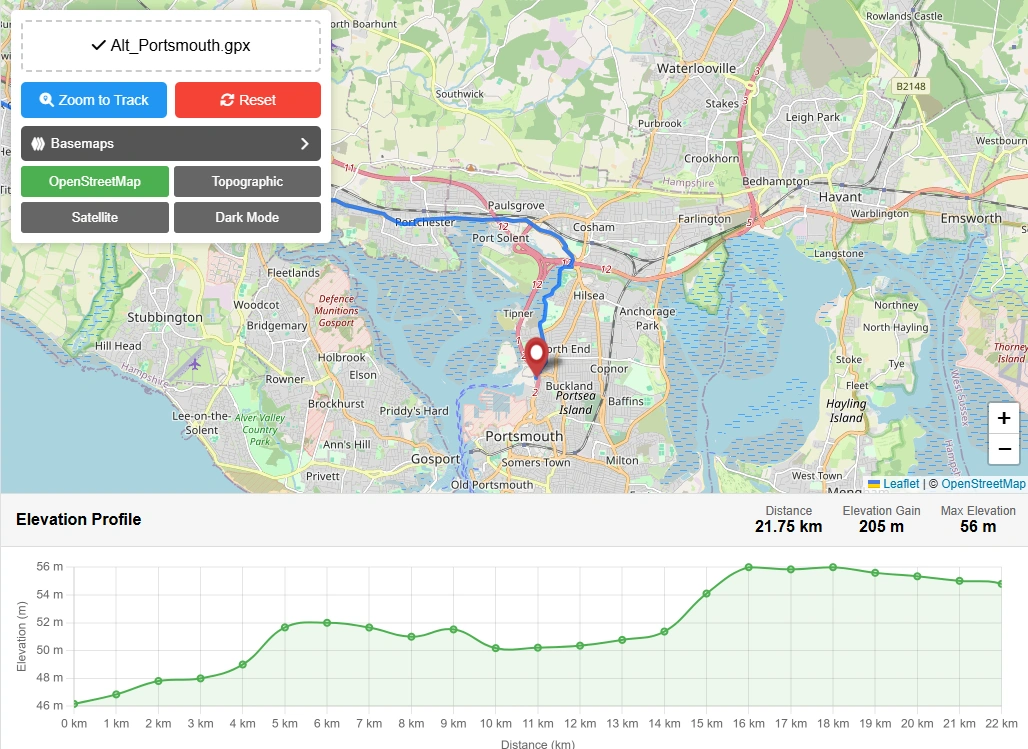
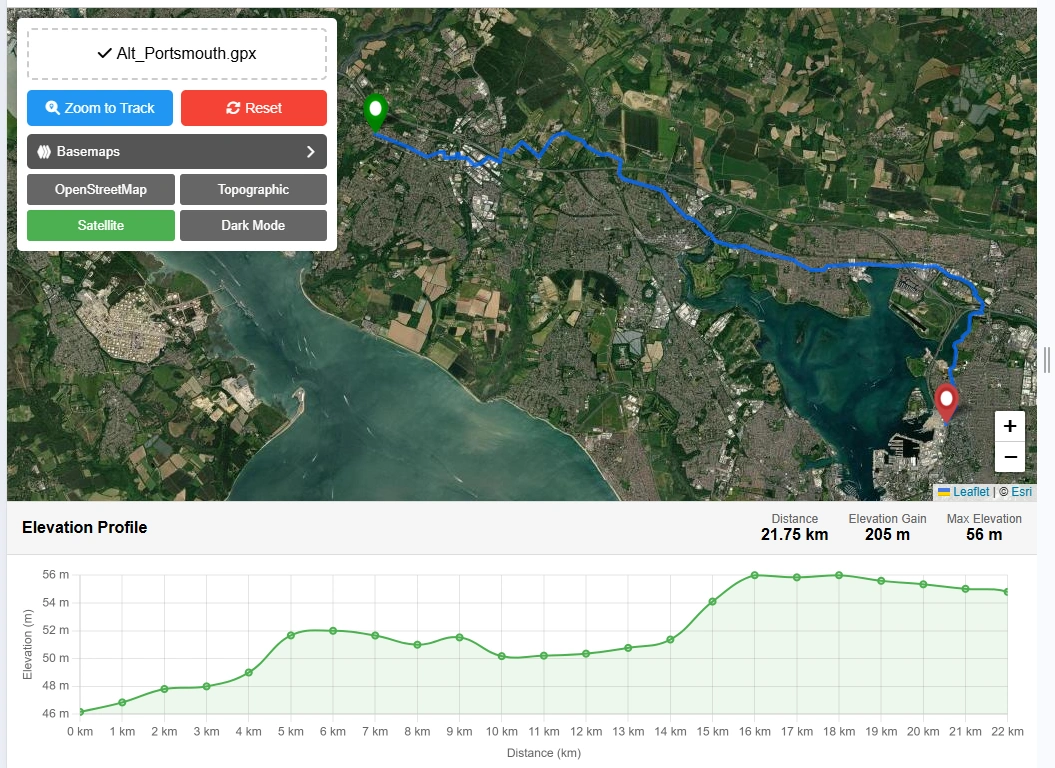
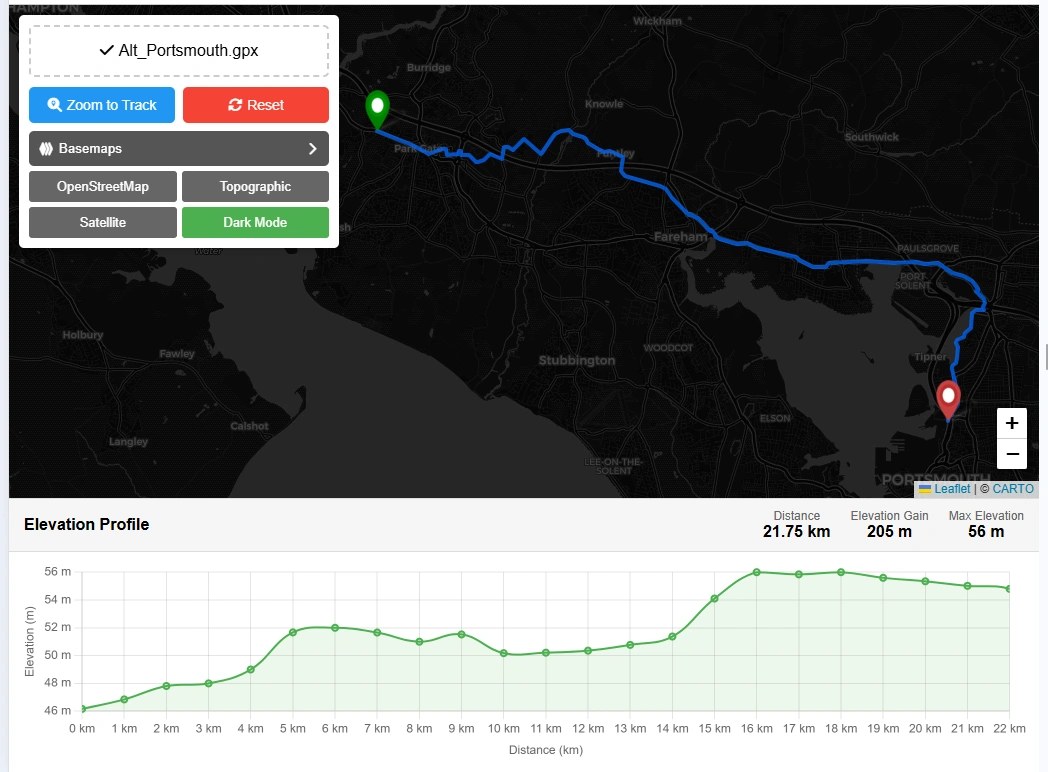
- Basemap Switcher — Street, Satellite (Esri), and Terrain map styles
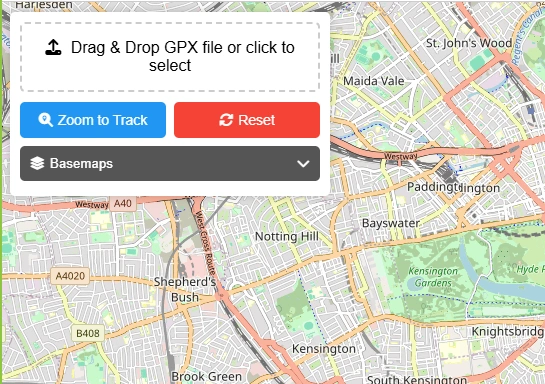
- Drag & Drop Upload — drop a GPX file directly onto the map or click to browse
- 100% Client-Side — GPX parsing happens entirely in your browser; no data is sent to any server
- Works with Large Files — tracks with thousands of points are downsampled for smooth chart rendering
How to Use the GPX Viewer — Step by Step
1Upload your GPX file
Click the "Upload GPX" button in the toolbar, or drag and drop your .gpx file directly onto the map. The track will appear immediately.
2Explore the track on the map
The GPS route is drawn as a blue line. Green dot marks the start, red dot marks the end. Pan and zoom to explore the route, or switch to Satellite or Terrain view.
3Read the elevation profile
The elevation chart below the map shows altitude (m) on the Y-axis and distance (km) on the X-axis. The filled green area represents the elevation band of your route.
4Hover to inspect any point
Move your cursor over the elevation chart. A tooltip shows the exact elevation and distance at that position, and an orange marker on the map follows along the track.
5View track statistics
The stats bar below the map shows total distance, elevation gain and loss, max and min altitude, total track points, and trip duration if time data is available.
6Switch basemap for context
Use the Street / Satellite / Terrain buttons to change the background map. Satellite view helps identify landmarks; Terrain view shows relief and contours along the route.
What Is a GPX File?
GPX (GPS Exchange Format) is an open XML-based standard for storing GPS data — tracks, routes, and waypoints. Most GPS devices, fitness trackers, sports watches (Garmin, Suunto, Polar), and outdoor apps (Strava, Komoot, AllTrails, Wikiloc) can export activity data as GPX files. A GPX track typically contains a series of track points, each with latitude, longitude, elevation, and timestamp.
The beauty of the GPX format lies in its universal compatibility. Acting as an open, standardised data bridge, it seamlessly unites the software ecosystems of competing manufacturers like Garmin, Strava, and Komoot. Whether you are an estate agent assessing property terrain boundaries, a field scientist cataloguing remote research sites, or a marathon runner reviewing a race course, GPX turns abstract GPS data points into actionable, visualisable context — without requiring any proprietary software.
Who Can Benefit from This Tool?
▸Hikers & Trail Runners — Visualise your trail recordings and analyse the elevation profile before or after a hike.
▸Cyclists — Review your ride on a map, check the total climb and descent, and compare routes.
▸Runners & Athletes — Upload Garmin, Suunto, or Polar GPX exports to inspect elevation and distance data.
▸Travel Bloggers — Create route maps from your GPS tracks to embed in blog posts or share with readers.
▸Orienteerers & Rogainers — Review your course track and elevation changes in detail after an event.
▸GIS & Mapping Students — Quickly inspect GPX files from fieldwork without needing desktop GIS software.
Deconstructing the Vertical Axis
Flat maps obscure the true difficulty of a route. A simple line from point A to point B cannot show the unexpected steep inclines or rapid descents that dictate how much energy a journey demands. This is where an interactive elevation profile changes the game. The viewer processes a GPX data stream through three stages:
GPX Data Stream→Parse Lat/Lng + Elevation + Time→Interactive Map & Elevation Chart
By rendering spatial coordinates alongside a vertical SVG graph, the viewer shows users exactly where they will encounter the steepest segments of a journey. Hovering over any point on the elevation chart syncs directly with a marker on the map — allowing a cyclist or hiker to trace a route kilometre by kilometre, identifying the exact physical landmarks where a gentle incline shifts into a demanding climb.
The Mechanics of Desktop-Free GPX Analysis
Historically, analysing high-resolution GPS track data required installing bulky, specialised Geographic Information System (GIS) software. Modern web standards have bypassed this roadblock entirely by running the parsing logic directly inside the browser using client-side JavaScript. This architecture brings two concrete benefits to everyday users:
Absolute Privacy
Because data parsing happens entirely on your local device, sensitive personal tracking data — like where a workout started or ended — is never transmitted to an external server.
Algorithmic Smoothing
Raw GPS files often suffer from data noise — minor coordinate errors that artificially inflate total vertical climb statistics. Large files with thousands of track points are downsampled for smooth chart rendering and accurate gain/loss figures.
Frequently Asked Questions
How do I open and view a GPX file on my phone?
Most mobile operating systems cannot open .gpx files without a dedicated app. Common options include Gaia GPS, Komoot, AllTrails, and Organic Maps. Alternatively, open this viewer directly in your mobile browser — it is fully responsive and runs entirely on your device, so no app download is needed.
Why does my GPX file show no elevation profile?
This happens when the file was created by a route planner that did not inject terrain data, or was recorded on a device that only logged latitude and longitude without altitude. The viewer will still display the map track, but the elevation chart and gain/loss stats will show no data. To fix it, run the file through an online GPX elevation correction tool, which cross-references your coordinates with satellite terrain models to add the missing altitude values.
How do I convert a Google Maps route into a GPX file?
Google Maps does not natively export GPX files. The common workaround: map your route in Google Maps on a desktop, copy the browser URL, then paste it into a free converter such as Maps to GPX. Download the generated .gpx file and drop it directly into this viewer, or import it into your Garmin Connect or Strava account.
What is the difference between elevation gain and maximum elevation?
Elevation gain (total ascent) is the cumulative sum of every upward step during the journey. If you climb a 50-metre hill, descend, then climb it again, your total elevation gain is 100 metres — it accumulates. Maximum elevation is simply the single highest point above sea level reached during the trip; in that same example it remains 50 metres regardless of how many times you climbed.
Why do Strava and Garmin show different elevation gains for the same activity?
Garmin watches typically use an internal barometric altimeter measuring changes in air pressure. When that data syncs to Strava, Strava often overwrites it with its own satellite terrain contour database. Weather changes, air pressure variations, and differing smoothing algorithms can cause the two platforms to diverge by 15–20% on the same activity. This viewer uses the raw elevation data recorded in your GPX file, without third-party correction.
What does downsampling a GPX file mean, and why is it necessary?
A fitness watch recording a long hike logs a data point every second, creating files with tens of thousands of rows. If a browser renders all those points simultaneously it will lag or freeze. Downsampling uses smoothing algorithms to discard redundant points along straight or flat segments while preserving the essential shape, bends, and vertical shifts of the route — giving you a smooth, accurate elevation chart without the performance cost.
How do I upload a GPX route to my Garmin watch?
Download the .gpx file to your phone or computer, then open Garmin Connect and upload it as a Course. Once saved, sync your watch via Bluetooth. On the device, open the Navigation or Courses menu before starting your workout — your route line and elevation profile will appear on your wrist display.
Can I import a GPX file into Strava to create a route?
Yes, but only via the Strava website — not the mobile app. Log in, hover over the plus (+) icon at the top right, and click Upload Activity to log it as a past workout. To use it as a future navigation course, open Strava's Route Builder and click Import GPX to convert the file into a traceable guide.
What is the difference between a GPX file and a KML or KMZ file?
GPX is the universal open standard for athletic and outdoor data, optimised for a time-sequenced stream of coordinates paired with elevation and timestamp values — which is why all fitness platforms and GPS watches use it. KML and KMZ (Keyhole Markup Language) were developed by Google for Earth-style visualisation and focus on display elements like coloured polygons, 3D outlines, and custom icons rather than elevation or time data. KMZ is simply a compressed (zipped) KML file.
Is it safe to upload my GPX files to online viewers?
It depends on how the viewer is built. Server-side tools upload your file to an external machine, which could expose sensitive location data such as where a run starts or ends — potentially revealing your home address. This viewer is 100% client-side: all GPX parsing and rendering happens entirely inside your browser using JavaScript. Your file is never transmitted to any server, never stored externally, and is gone the moment you close the tab.
Open Source & Credits
- GPX parsing: built-in browser DOMParser — no third-party library
- Elevation chart: custom SVG — no charting library dependency
- Map tiles: CARTO, OpenStreetMap, Esri
- Map library: Leaflet JS — open-source interactive mapping